

The province of Ontario has lowered the criteria for inclusion in each of the colour-coded stages, meaning it’ll be easier for the province to move regions into more restrictive zones.
Previously, regions having a weekly incidence rate of 100 new cases per 100,000 people, or a positivity rate of 10%, were designated as red zones. Now, regions having a weekly incident rate of 40 new cases per 100,000 people and a positivity rate of more than 2.5% will be designated as red zones.
In light of this change, the City of Hamilton will be bumped to the CONTROL stage in the red colour-coded Covid restrictions tier, effective Monday November 16, 2020.
New Restrictions for a Safer Community
The restrictions imposed by the Control stage in Hamilton will further minimize the community exposure of CIC staff and students. The restrictions include a new gathering limit for all organized public events, social gatherings, restaurant dining and gym classes of 10 people indoors and 25 people outdoors.
More details on the public health measures for each stage of the Province’s Framework – https://www.ontario.ca/page/covid-19-response-framework-keeping-ontario-safe-and-open#red
The red zone is a Control stage, not a lockdown stage.
CIC’s Protocols Go Beyond Provincial Requirements
CIC’s stepped-up Health & Safety protocols implemented in February 2020, and updated regularly, go above and beyond provincial standards. They include the use of masks and face shields (double layers of protection), temperature checks, screening survey, deep cleaning, quarantine, no visitors policy, cohorting and much more. You can review the protocols at https://www.cic-totalcare.com/newsletters/cics-safety-protocols-exceed-required-standards/
COVID-19 in Hamilton
The graph below shows the number of new cases reported by the City of Hamilton daily from November 6 to 13, 2020.
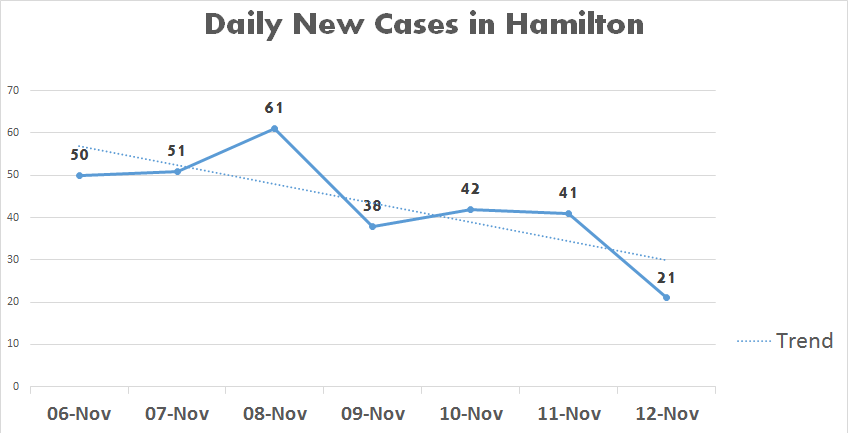
Data Source: Public Health Hamilton
New Daily Cases in Canada and Other Countries
The next graph compares new cases average between November 6 and 12 for Canada, the province of Ontario, Toronto, Peel and York Regions and the cities of Ottawa and Hamilton.
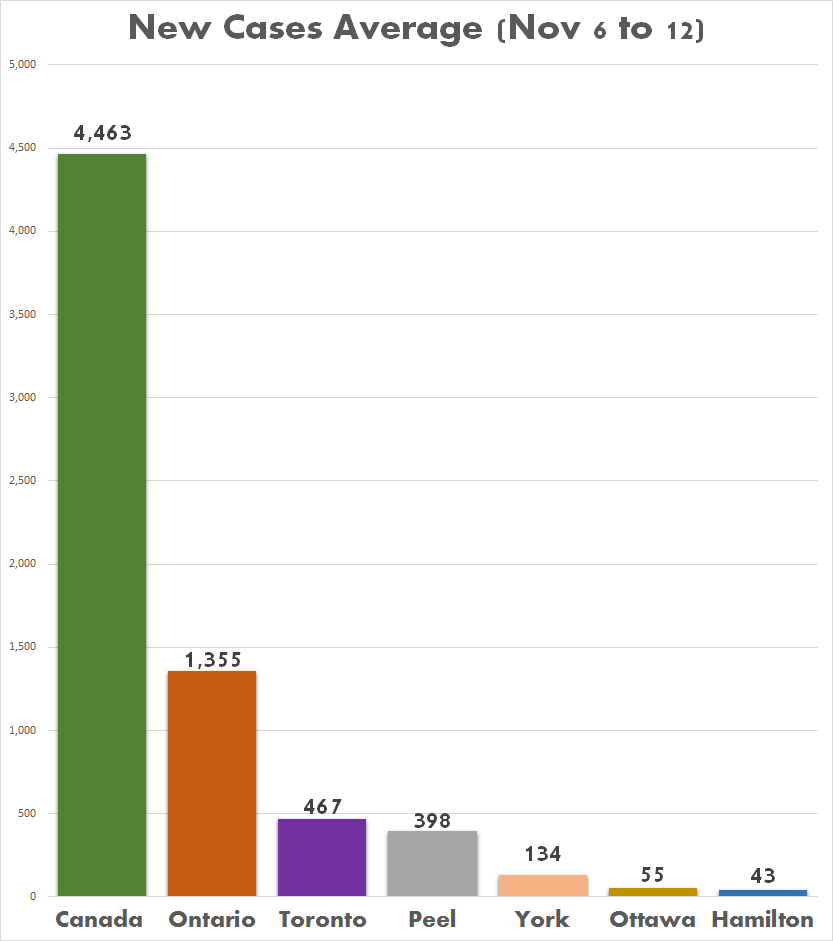
Data Source: Public Health Canada, Ontario, Toronto, Peel, York, Ottawa, and Hamilton
The graph below compares the number of daily new cases reported on November 15, 2020 in the US, Italy, France, UK, Germany, and Canada.
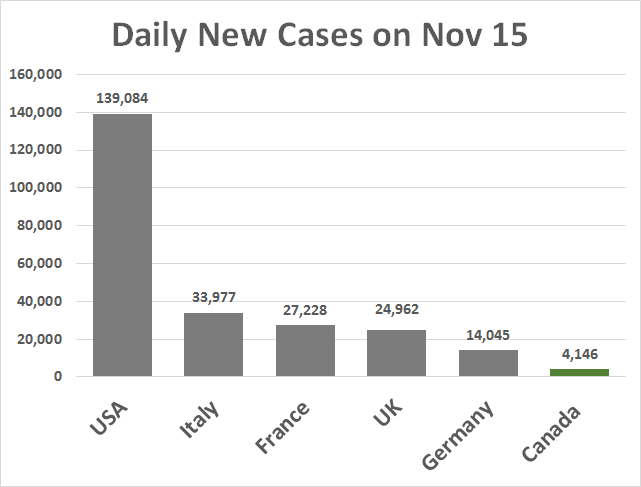
Data Source: https://www.worldometers.info/